Pulse
The Pulse reflects the overall statistics for the project over a period of time. Statistical data is reflected in the counters.
Counters
Counters display the main statistical indicators for the selected period.
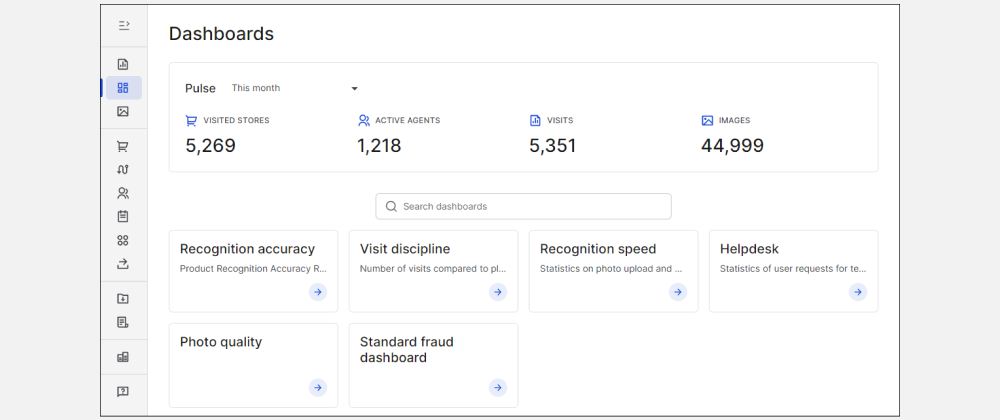
- Visited stores — the number of stores visited by agents.
- Active agents — number of routes to stores.
- Visits — visits made by agents in visited stores. Only non-deleted visits for the selected period are displayed.
- Images - the number of images received by the portal.
Change period
By default, Pulse displays project statistics for the current month. You can view project information for other periods.
- Click on the window with the selected period.
- Select from the dropdown list:
- Today - information from 00:00 Moscow time;
- Yesterday — for yesterday;
- This week - from Monday of the current week;
- This month — from the 1st of the current month;
- This year — from January 1 of the current year;
- All — for the entire period of the project.
If you need to set the period manually, click Selected period. After that, in the columns "From" and "To" set the start and end dates of the period and click Apply.
The information on the counters and the map will be updated according to the selected parameters.
If you have any questions or problems, contact support.